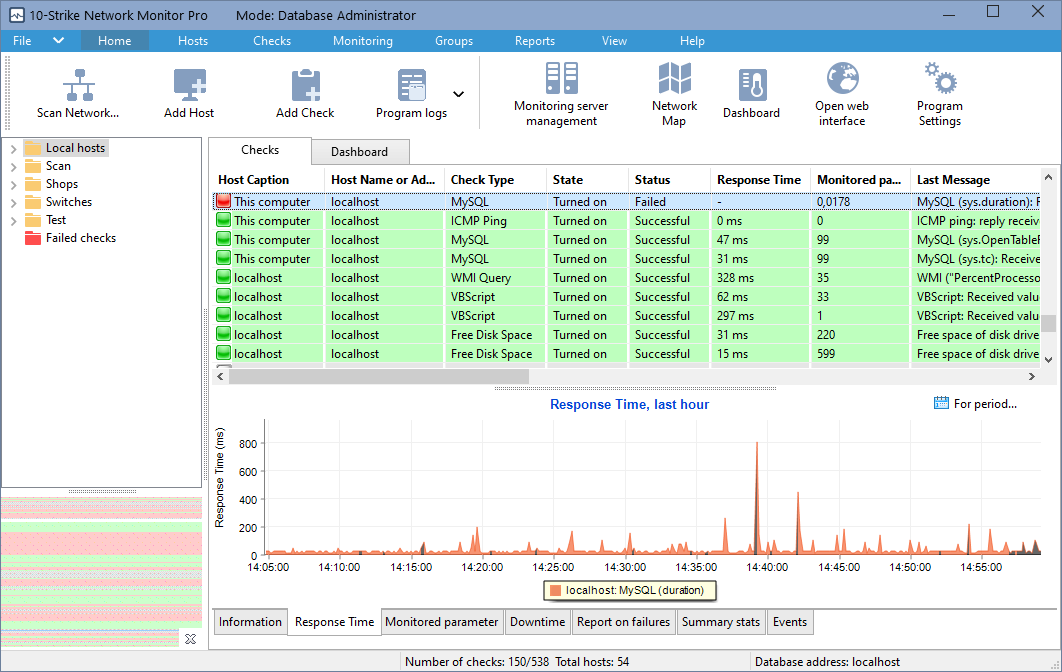
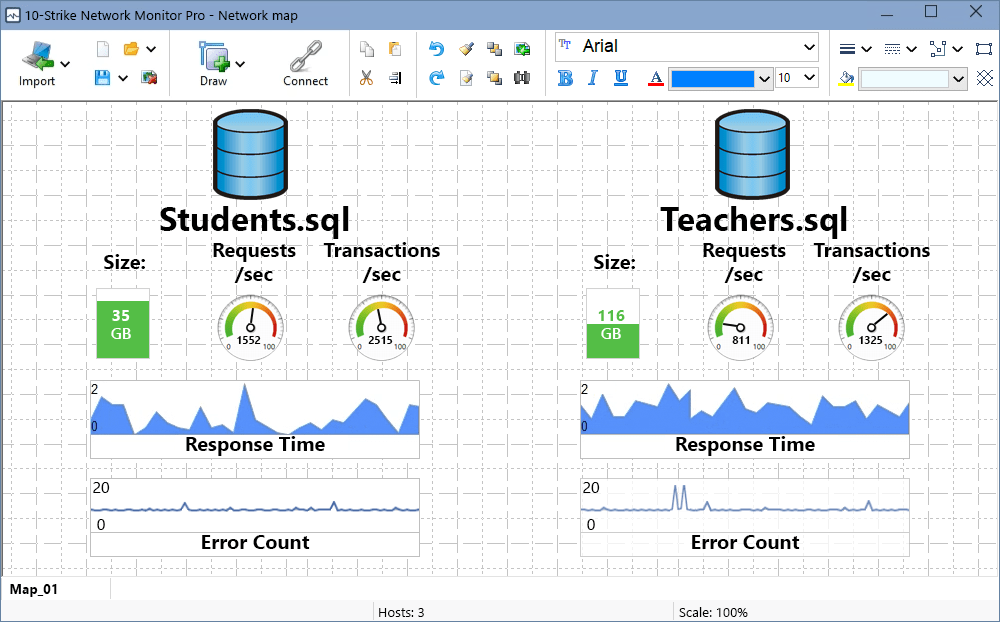
10-Strike Network Monitor allows you to monitor network MS SQL, MySQL, and ODBC databases.
The “MS SQL Server”, “MySQL”, and “ODBC” checks allow monitoring the state of the respective DBMS and alert when malfunctions in their operation are detected. The check algorithm consists in attempting to connect to the databases with the specified authentication parameters periodically. If the DBMS returns the successful connection result, the check is considered passed.
Moreover, the program can run arbitrary SQL queries, get the results, and analyze the returned values.
The client DBMS library libmySQL.dll is necessary for the successful operation of the “MySQL” check. One of its versions is distributed along with the application. It can be located either in the Windows folder or in the application's folder.
To enable the “MS SQL Server” check, the computer must have the client part of that DBMS. The application supports both Windows and custom authentication by specified login and password.
How to Configure Database Monitoring (MySQL Example)
The database health monitoring ensures that the database performance and availability are maintained. The database monitoring includes the control of many parameters and metrics provided by the DBMS, as well as the detection of errors in its operation.
We will describe several basic metrics that can be used to judge the state of the database using the 10-Strike Network Monitor program and MySQL as the example.
1. Availability and Uptime
The availability of a database can be checked by connecting to it from remote hosts. A connection error may indicate the database service's stop or a blocking of the database port by third-party programs.
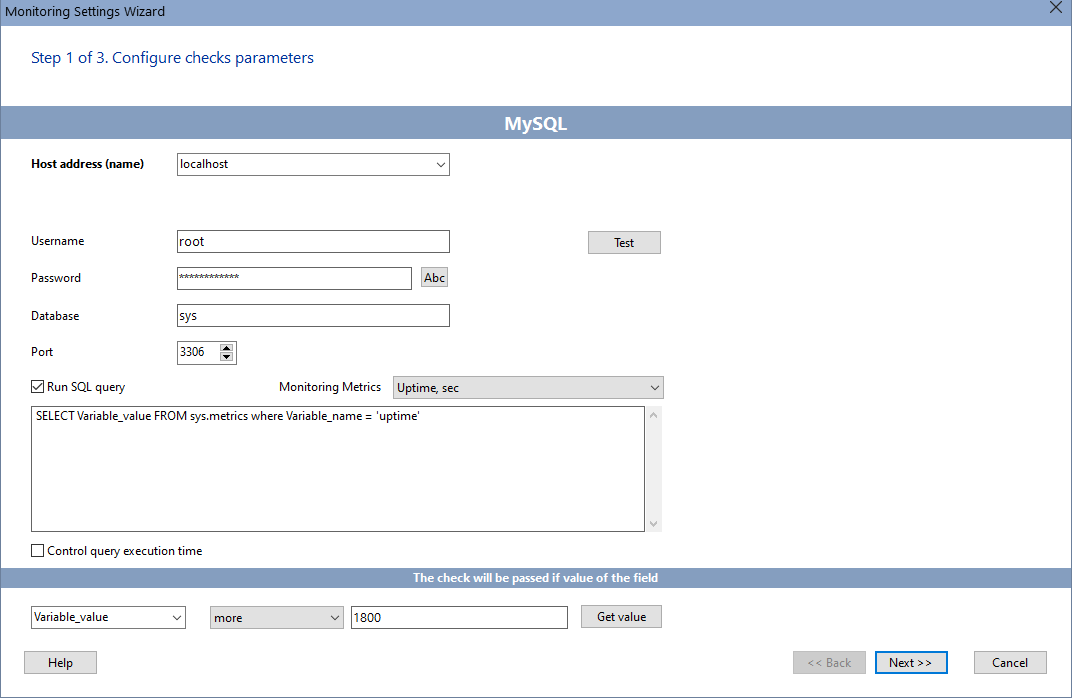
The uptime parameter helps you learn about fast database restarts. Such restarts may not be covered by the availability check, so it makes sense to check how long the database has been running without failures and shutdowns. For example, you can set the alert threshold when
uptime < 1800
where 1800 is the database uptime in seconds since the last run.
2. Error Connections
One of possible problems in the database operation is the connection errors of new clients. The Number of Connection Errors metric lets you identify times when the database generates these errors too frequently. It includes the following MySQL server state variables (counters):
- Connection_errors_accept
The number of errors that occurred during the accept() calls on the listening port. - Connection_errors_internal
The number of connections rejected due to internal server errors, such as failure to start a new thread or running out of memory. - Connection_errors_max_connections
The number of connections rejected because the server's max_connections limit was reached. - Connection_errors_peer_address
The number of errors encountered while looking up the connecting client IP addresses. - Connection_errors_select
The number of errors that occurred during the select() or poll() calls on the listening port (failure of this operation does not necessarily mean that the client connection was rejected). - Connection_errors_tcpwrap
The number of connections rejected by libwrap.
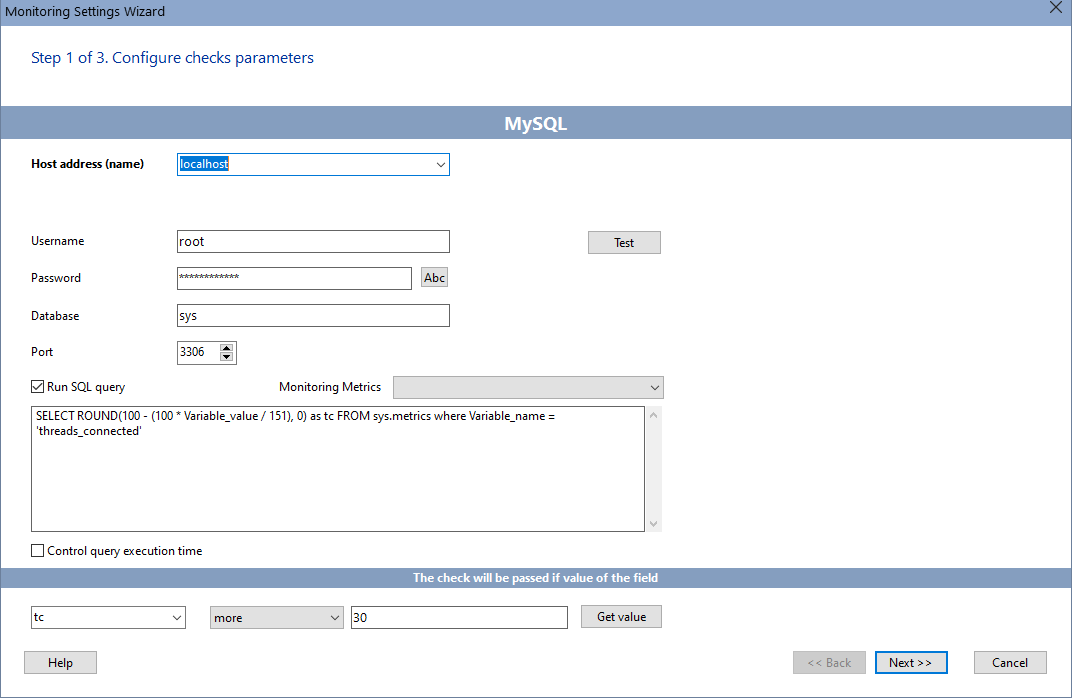
If the max_connections parameter is incorrectly set in the MySQL server settings, then the database may fail with a large number of simultaneous connections, increasing the Connection_errors_max_connections counter. You can prevent this situation by monitoring the ratio of the number of current connections to the maximum possible. For this purpose, you can use the following query:
SELECT ROUND(100 - (100 * Variable_value / [max_connections]), 0) as tc FROM sys.metrics where Variable_name = 'threads_connected'
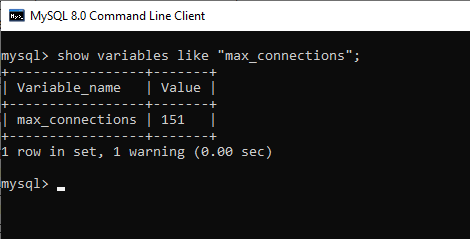
where instead of [max_connections] you need to substitute the actual value of the max_connections parameter (by default it is set to 100). You can get it with a query in the MySQL console:
show variables like "max_connections";
This command will return something like this:
The tc query variable will show the percentage of available connections, and the threshold can be set to 30%.
3. Slow Queries
MySQL keeps a log of slow queries. The number of entries in this log can be found using the slow_queries metric. To find its value, you can use a simple SQL query:
SELECT Variable_value FROM sys.metrics where Variable_name = 'slow_queries'
The program may respond to changes to this setting by reporting new entries in the slow query log, which may indicate performance issues.
4. Join Queries
Using the join request execution counters, you can be notified about operations that consume too many resources.
- Select_full_join
The number of joins that perform table scans because they do not use indexes. If this value is not 0, you should carefully check your table indexes. - Select_full_range_join
The number of joins that used range lookups in the lookup table. - Select_range_check
The number of joins without keys that check for key usage after each row. If they are not 0, then you should carefully check your table indexes. - Select_scan
The number of joins that performed a full scan in the first table. - Select_range
The number of joins that used the ranges in the first table. This is usually not a critical issue, even if the value is quite large.
5. Cache Hit Rate
MySQL uses an in-memory cache to optimize disk reads and writes. A low Cache Hit Rate affects database performance. This query helps to calculate the cache hit rate value of open tables:
SELECT ROUND((open_cache_hits / (open_cache_hits + open_cache_misses)), 2) * 100 OpenTableFactor FROM (SELECT variable_value open_cache_misses FROM sys.metrics WHERE variable_name = 'table_open_cache_misses') miss, (SELECT variable_value open_cache_hits FROM sys.metrics WHERE variable_name = 'table_open_cache_hits') hits;
Set the threshold OpenTableFactor to 90%, and if the value is less, the program will notify you.
6. Query Execution Time
Another indicator of the database performance degradation is the query execution time. You can write a test SQL query and measure its execution time under normal conditions. The resulting value can be used as a threshold for this test. A significant query timeout for a long period of time may indicate that the database is heavily loaded, and users have to wait a long time for a response from it.
MySQL has a large number of metrics that allow you to evaluate the health of the database. Most of them can be found in the INFORMATION_SCHEMA (sys) system tables. The tables and views in this schema are available for data retrieval. The program supports the execution of arbitrary queries, allowing you to create a wide range of database performance checks.
Monitoring Other Databases
Nobody knows what a failure in the operation of a DBMS can turn out to be for a company. But, unfortunately, this happens. And if the database has become unavailable, then the faster it is restored, the less losses can be dispensed with. That is why it is very important to learn about database failures and their nature in a timely manner.
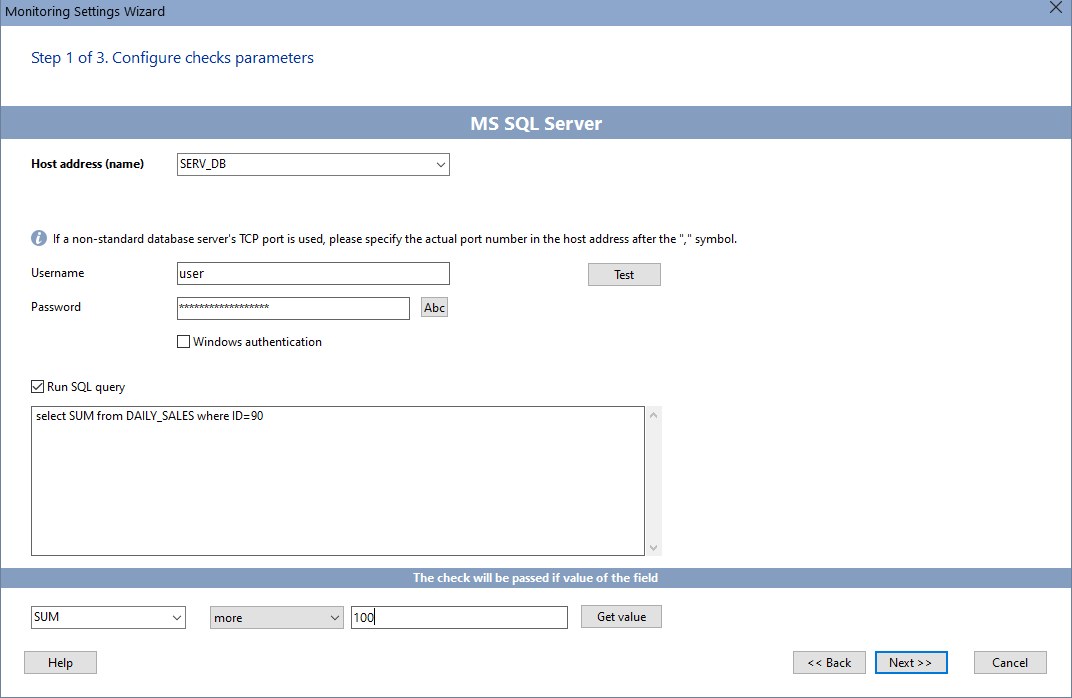
You can set up the SQL database monitoring using 10-Strike Network Monitor. Add the "MySQL", "MSSQL", or "ODBC" check and configure the connection settings by specifying the database SQL server address, port, login and password. Select a metric to monitor or specify an SQL query that retrieves values from database tables.
The 10-Strike Network Monitor program connects to the database at a specified frequency and executes a test SQL query, thereby making sure that the DBMS is working properly.
The following DBMS are supported:
• Microsoft SQL
• MySQL
• any other DBMS that supports connection via the ODBC interface (MSAccess®, Oracle®, Sybase, FireBird, and many others).
Using SQL queries to the database server, you can also monitor third-party services, that store and update their parameters in it. If the parameter value is out of range, the program will notify the administrator about it.
Business process monitoring
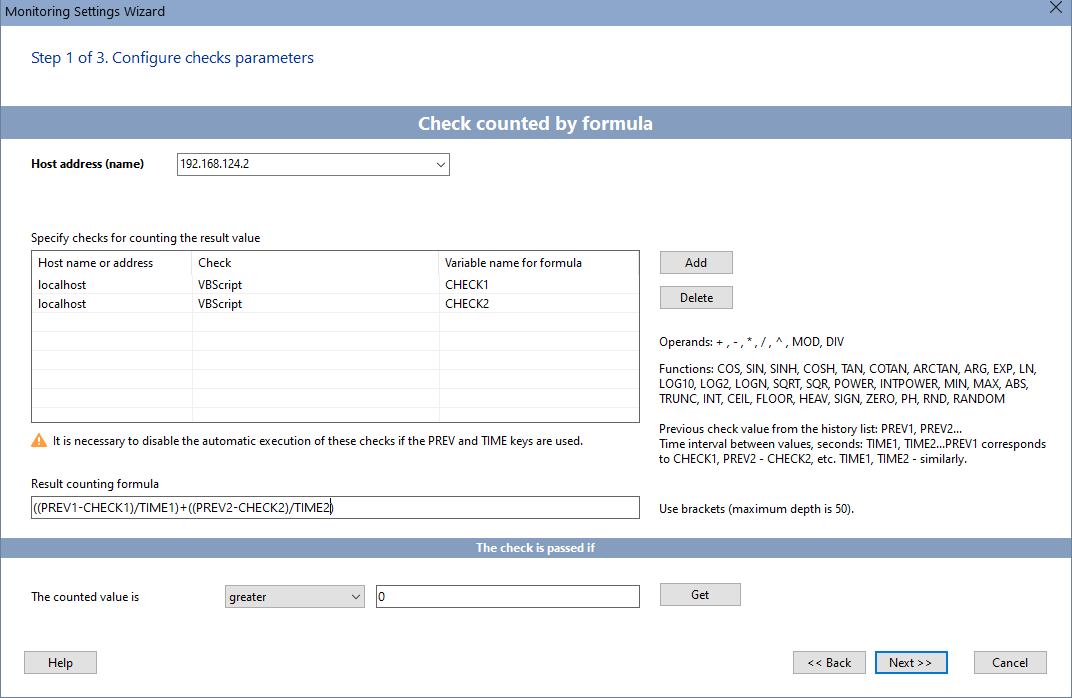
You can also set up monitoring of the company business processes by processing the values and metrics stored in the database using SQL queries: the number of sales, revenue, costs , etc. Checks with SQL queries can be used either one at a time or combined into a formula, to calculate a more complex value. For these purposes, the program implements the Check Counted by Formula. For example, we can create two checks for different databases and use the resulting parameters to calculate some other value using the given formula.
See also: HTTP(S) Web Server Monitoring, Web Page Context Monitoring, FTP Server Monitoring
Requirements: Windows XP/Vista/7/8.1/10/11, Server 2003/2008/2012/2016/2019/2022 supported.
