This feature is available in the PRO version only.
By using the installed Remote Agent, the Application can receive information on the CPU temperature and voltage, HDD temperature, fan speed, CPU core load, RAM load, GPU temperature, and monitor these parameters. For example, you can learn that the monitored server's cooling system has failed, and quickly take measures to prevent its further overheating. To configure the monitoring of a parameter, first select it from the list of available parameters that the Application can receive. This kind of checking is resource intensive, so avoid creating too many checks to frequently get data from one Agent. The recommended polling interval is 30 seconds or more.
For this check to work, you need to install the Remote Agent on the target computer.
.NET Framework 4.0 (or a newer version) is required on the remote computer (with the Agent installed) for the motherboard sensor monitoring.
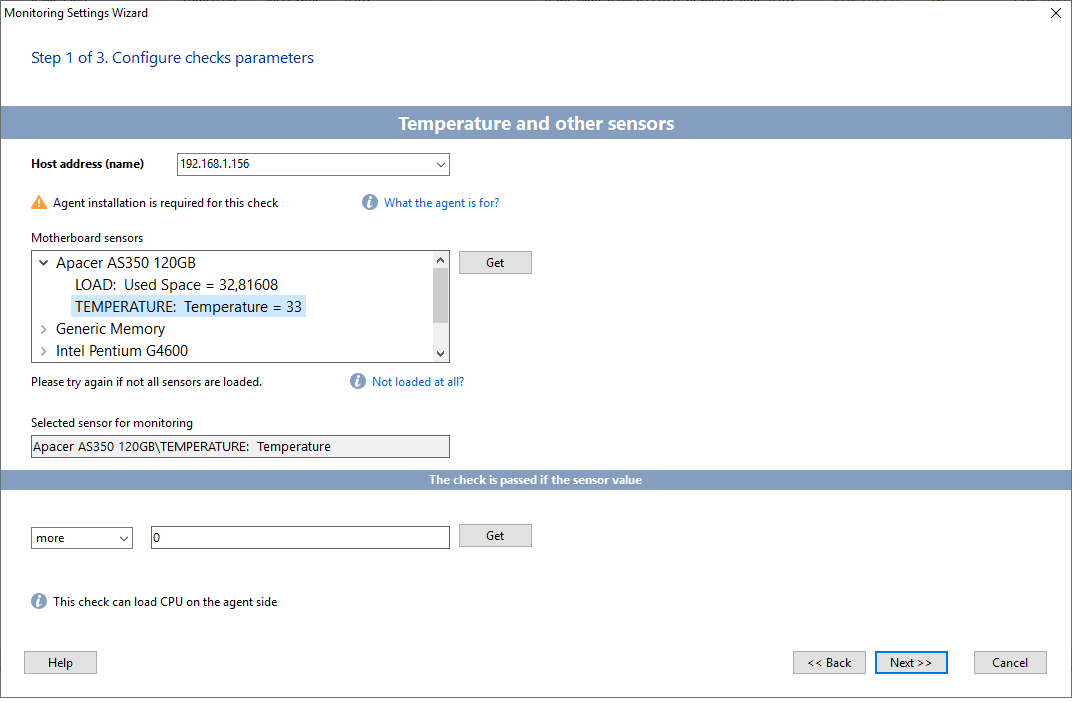
Find the name of the necessary equipment in the list of motherboard sensors and expand its node. In the list you will see the processor temperature, CPU core load, fan speeds, and GPU temperature. Select the desired parameter to monitor and set the alarm logic. For example, “the check is passed if the sensor value is less than 70” (for example, if we are talking about temperature in degrees Celsius). If the value is greater than 70, the check will be considered as failed and you can enable an alarm notification in further check properties. You can select any value suitable for the equipment (maximum temperature thresholds can be found in the documentation for the device).
When monitoring the fan speed, the current speed must be above a minimum threshold to be able to detect whether the fan is stopping or slowing down.
Go to the following steps: change the check execution parameters or leave them as they are. Set the alert parameters for generating alarms notifications if the check fails. And then save the changes.
As soon as you add a new check, it will start collecting data. You can watch the data collection process by switching to the Monitored parameter tab (click the tab at the bottom of the window). Network Monitor will display a temperature graph.
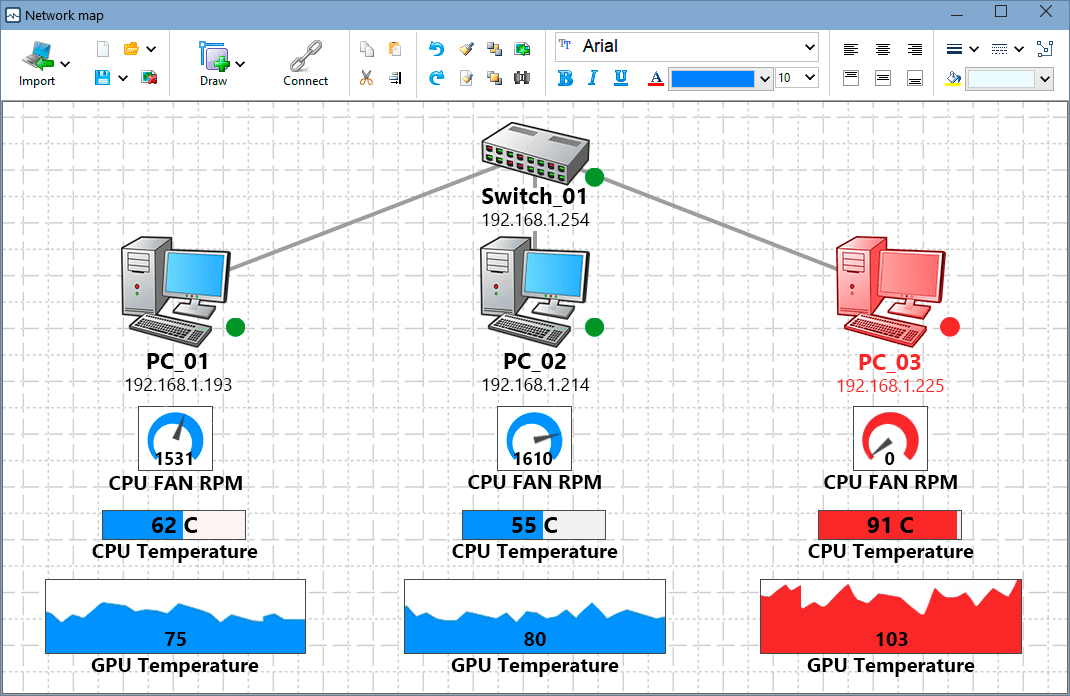
You can also add graphic widgets to the dashboard pane or to the network map in order to observe your computer park over the network this way...

Failed checks will be make the corresponding indicators and host icons red or yellow.
Find more details in this article:
Requirements: Windows XP/Vista/7/8.1/10/11, Server 2003/2008/2012/2016/2019/2022 supported.

